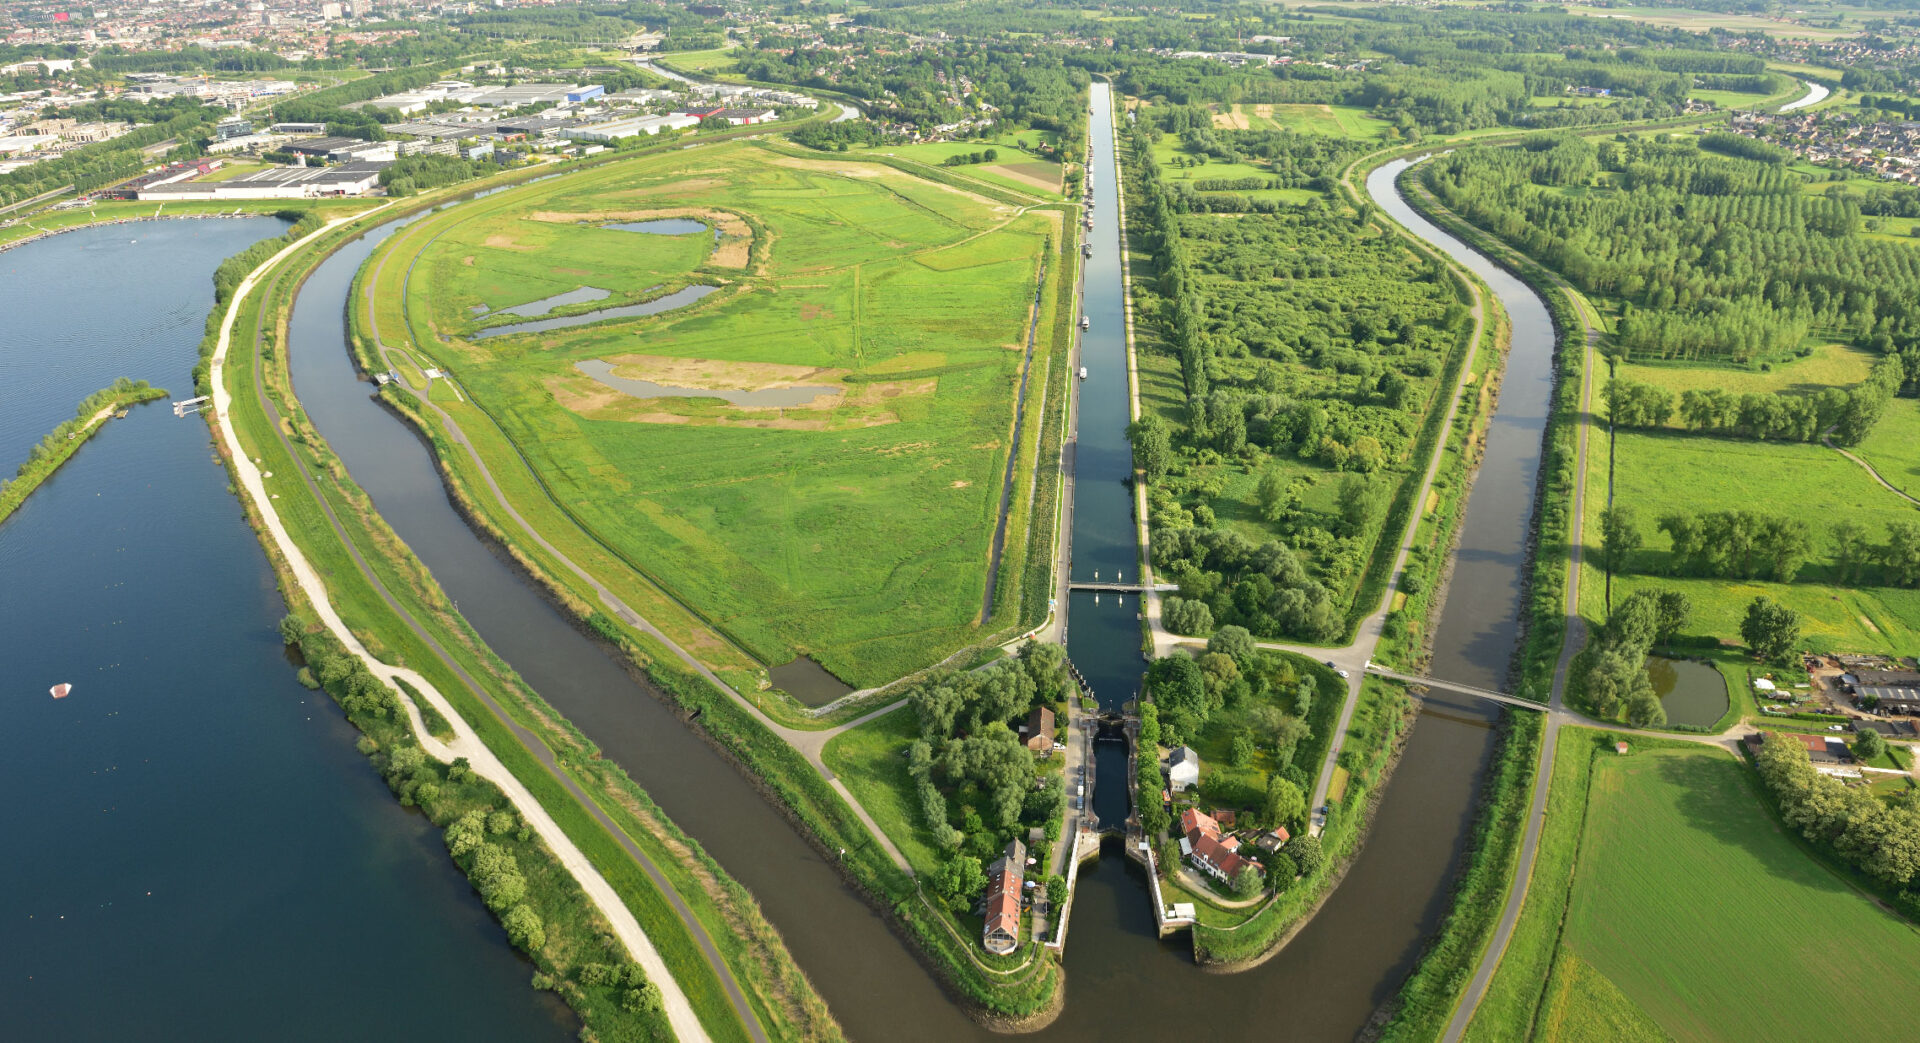
The Dike Test is a GIS tool developed in 2010 to estimate the risk of breach formation due to geotechnical failure of a dike. Starting from a comprehensive set of parameters related to hydraulic loading, dike strength and aggravating elements such as animal grazing, the tool calculates a score for 6 different failure mechanisms.
The challenge
Vlaamse Waterweg nv had the desire to convert – what was initially an offline tool – to an online application and to automate the underlying calculations in the process as much as possible. The dike data needed to perform the test is scattered across various databases and applications and available in different formats. So we did an analysis of through which environment the operations are best performed and through which platform the results are best visualized.
Most of the users are satisfied with visualizing the results for the current condition of the levees. A limited number of users must also be able to calculate scenarios for themselves, for example, to test the impact of a change in the lining of the dike, the construction of a salt marsh, and so on.
Our approach
As a first step, an inventory was made of where the necessary input parameters are available and in what way the data can be linked in the tool (via web services). When required input parameters are not available, suggestions were provided to create the data. This information was collected through queries to the various agencies that create and/or manage the data (e.g. INBO, Hydraulic Laboratory, etc.). Through conversations with the customer, functional and non-functional needs were identified.
Centralized management and the use of web services provide users with the latest available information on the condition of the dikes at all times
The solution is based as much as possible on ESRI technology. A central database collects all necessary input parameters, via services or manual delivery. The administrator of this database performs quality checks and then makes the data available for calculations via web services. The computational tool is being developed using the extensive geoprocessing and Python capabilities in ArcGIS Pro. Through OGC services the results flow through to external geolocatories (e.g. DOV-Dijkenverkenner), for the limited number of users the tool is also made available through services.
The result
Through centralized management and the use of services, users are always provided with the latest available information on the condition of levees, which is essential to ensure flood safety. By using an open geoprocessing geoprocessing framework in ArcGIS Pro, the calculations in the tool can be flexibly adapted. This is especially important when new (scientific) insights are gained about the failure mechanisms.
Most of the users of the viewer are the levee managers of The Flemish Waterway. The users to test scenarios themselves are primarily internal employees doing policy preparation work, and external employees at Department of Geotechnical and Hydraulic Engineering Laboratory. But in time, new user groups may emerge, such as engineering firms or developers.


